Posts

Getting tired of the claims for LED lighting (in this case Sunmatic)?
Image
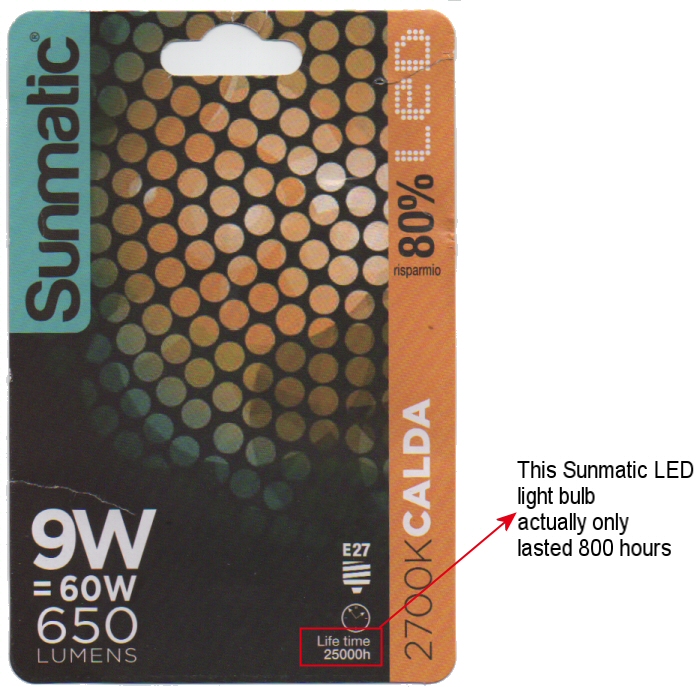
Is anybody else getting tired of the claims of LED light bulb manufacturers? Sunmatic claim that this light bulb will last 25000 hours... ...it actually lasted less than 800, that is less than 4% of the claim. Well done SUNMATIC. Or should that be be GPBM Nordic? Sunmatic GPBM Nordic were wrong by 96% on the lifetime of their bulb,  which if applied to the other numbers would mean:  3.2% energy saving (not 80%) 21 lumens (not 650) Something horribly wrong with the Kelvin figure. (I started actually measuring a bit more carefully the life of lightbulbs when several Philips light bulbs failed well before their claimed life.)

The OXL photometric file format, with spectrum, photos, and more...

Image
The OXL file format is an XML based format which contains the photometry (like an IESNA .IES or an Eulumdat .LDT) file format, but adds much much more. The OXL file format is open and free to use by any company. Here's an overview of what an OXL file can contain: As you can see there must be a photometry, and to that you can any or none of the following things: PDF data sheet. Photo. Spectral data. 3D model (a simplified 3D model is ideal for Revit applications). So when a customer wants details about your luminaire, you don't need to send him N files, just a single OXL file. Now I think examples are easier to understand than formal definitions, so here is what the start of an OXL file looks like: Because Eulumdat and IESNA files are so constricted, some companies " expand and re-interpret " them, with non standard "extensions" which only a few programs (mostly company internal programs) understand. These e...

CIE88 2004, Calculation of Tunnel Lighting Transition Zone Length

Image
This article is a bit of extra help for this one (on CIE88 2004). We know that we need to arrive at an internal tunnel luminance Lin, and we know we start at the formula for calculating the curve is the one given above, Ltr.  Time and distance are related by the fixed velocity, v, of the tunnel project. If we get the time taken to go through the transition zone we can easily get the length of the transition zone. Re-arranging the original equation... So you can calculate d, the length of the transition zone, from these three things: the project velocity the threshold luminance the internal luminance. (Thanks to Bui Duc Han for correcting an error in a previous version of the steps above.)

Comparisons of UNI11095 2003, CIE88 2004, UNI11095 2011 Tunnel Lighting standards

Image
( See also CIE88 2004 ) Here are the Luminance Grids for calculating L seq . of all three standards: In all three standards there are 9 rings and 12 (radial) sectors. The UNI11095 2011 grid weights the upper and lower fractional sections by their reduced area.  The CIE88 2004 has the "tallest" grid but the uppermost and lowermost areas are not used in the calculation, as they are considered to be outside a normal person's field of view.  The UNI11095 2003 grid did not take into account the fact that the upper and lower areas are smaller, but it did have a wider aspect ratio. UNI11095 2011 introduced a maximum curve above the minimum curve, presumably to encourage energy saving as well as luminous uniformity :

How To Calculate BUG Road Lighting Glare

Image
Though BUG ( IES TM-15-11, Addendum A) is quite hard to do, it is easy to understand, it gives you numbers for the "amount of light", wasted in various non-useful directions. B stands for Backlight, light thrown back away from the road. U stands for Uplight, light leaking skywards and causing light pollution. G stands for Glare, how much light is wasted shining directly into (a relatively distant) the driver's eye. The output of the luminaire is divided into several sub-zones:   Light issuing from High to Very High (H and VH) zones can cause glare from a distance and is anyway wasted light. These zones, both foward and back are used for the G rating. These are the red areas in the schematic below: Light sent to the B ack away from the road and towards the sidewalk (purple in the above diagram) is not useful fo...

Imaginary Colors

Image
I was watching QI (a BBC program of semi-serious questions and semi-serious answers, QI = Quite Interesting) and one of the questions which came up a few weeks ago was about imaginary colors. They messed up the graphics quite badly like this: So colors between deep blue and purple-red are not supposed to exist. QI did not explain why. I've seen in some textbooks that these colors are described as mysterious or anomolous. In the textbooks  this diagram is used... ...which at least gives a bit more "explanation" of why they should not be visible. According to some people, since they are on that strange lower edge, and not on the "spectral edge" they are therefore non-existent colors. (I found the reasoning to have the same weight as those who say "science says bumble bees should not be able to fly, but they can, so science is wrong!" It is clear to anyone with half a brain that bumble bees are not shaped like aircraft, are lighter and les...

Explanation of the CIE88 2004 Tunnel Lighting Standard

Image
The standard is officially called "Guide for the Lighting of Road Tunnels and Underpasses" and this article is about the 2004 version, which is currently in use. It replaces the 1990 version.  This article is a user friendly summary of the standard and ignores some details, for example daylight screens and emergency lighting. I'll just be looking mainly at the requirements for lighting tunnels in the daytime, a large part of which concerns the effect of the luminance of the areas surrounding the tunnel entrance. For an explanation of what luminance means , this book wi ll help you: You may have noticed that as you approach a long tunnel in bright sunlight the entrance often seems like a black hole:     In these cases, if there was an obstacle (like a stopped car or a drunk pedestrian) just a few meters into the tunnel you wo...

Unified Glare Rating (UGR) basic explanation.

Image
Although the formula looks very complex, scarily complex basically it is actually quite simple, taken a step at a time. First a diagram: Very roughly it is the luminance from the lamps divided by the background luminance from the room's walls and ceiling.  (For an explanation of what luminance means , this book... ...wi ll help you) Have a look at this detailed explanation of the formula for UGR: Log is log10 by the way. Lb, the background luminance or cd/m2rd, L is the luminance of the luminaire.  Looking at L and Lb, glare increases with stronger lamps and lower background lighting, whereas it decreases with weaker lamps and more background illumination.  p is the Guth index, which increases with distance from direct line of sight. So as the lamp moves further from the line of site, p increases and so the glare, as measured by the UGR, decreases. Som...

Understanding VH lighting photometric diagrams

Image
VH lighting diagrams are cartesian (compare with polar diagrams). They are normally used for floodlights. They show a "hemisphere of intensities", it is assumed that no light is projected out backwards. In the real world "out backwards" would be towards the sky or the spectators of a football match. The V and H angles are explained graphically here: And here is an example: In the icon top left the flat side of the hemisphere is the one which emits light. The diagram above will be easier to understand if you also look at this annotated photometric solid: Just to explain a bit more, imagine this luminaire is at the end of a playing field, above the goal, and imagine it is pointing into the center of the field: As the V angle increases you are pointing further and further away from the goal, and closer to the center of the field. You could imagine that...

How to understand photometric polar diagrams

Image
If you are working in the lighting industry sooner or later you will come across photometric diagrams and you must know how to interpret them. This blog entry page is quick introduction on how to look at a photometric diagram and get important information from it. Often photometric diagrams use the C-Gamma system. Gamma=0 points downwards towards the floor or road. Gamma=180 points upwards to the ceiling or sky. Here is a C-Gamma diagram with some of the luminous intensity “rays of light” left in: The "rays" make the diagram more confusing than it needs to be and photometric diagrams always leave out those “rays” to give you a simpler diagram as shown below: The point to remember is that the distance from the center of the diagram to one of the points on the “outline” corresponds to a luminous intensity value, often in candelas, in the given direction. These diagrams ...